As long as climate change remains a distant boogieman that will happen to them, to someone else, someplace else, we’re trapped in a vague abstraction. As I’ve reflected on what Elodie Blanc and Erwan Monier (listen to “Climate, Food Security and Water: podcast here) told us a few months ago - namely, that soils, water and crop yields will actually be better in some places, worse in others - I’ve wondered how the geography of climate change plays in public discussions about what to do.
Matthew Shaer in his recent New Republic article, States of Denial, has given us a sense of the ironies and even contradictions on the ground in places very likely to experience significant economic losses (particularly in the US South and Southwest), while others (US North) may even see gains.
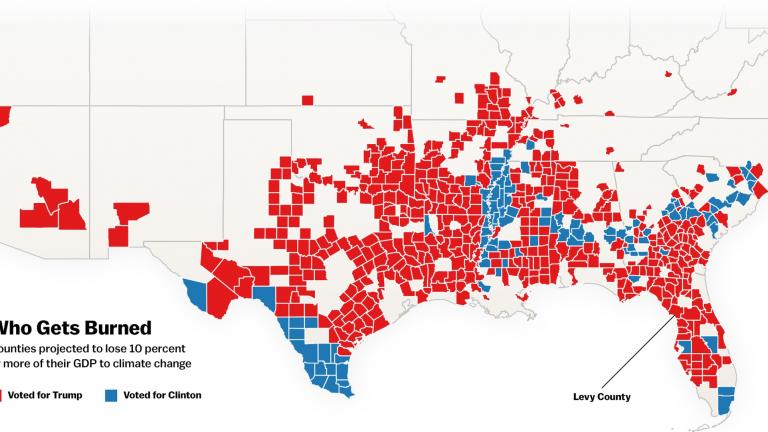
A new study in Science (Estimating economic damage from climate change in the United States) quantified a starkly inconvenient truth: Climate change is going to hit some parts of America far harder than others. By 2099, according to the study, 601 counties could lose at least 10 percent of their GDP to global warming through loss of jobs, soaring energy costs, and rising mortality rates. In a cruel twist, the counties marked as deep-red hot spots for climate damage are also the reddest when it comes to politics: All but 107 of them voted for Trump over Clinton. One of the hardest hit will be Levy County, Florida, where climate-related deaths are projected to rise eight times faster than the national average.
Shaer makes visible the face of climate denial - in the form of the Cycle Theory, repeatedly cited by those he visited in Levy County, Florida, as a reason not to worry - since “what gets worse also gets better, eventually.” Citations from academic journals don’t hold water with them - - - but then, what would? [I welcome your thoughts on that!]
What’s the geography of climate change where you live? What will be the distribution of benefits and burdens in your area - by place, by gender, by race, by income...? Do these come with ironies, political or otherwise?
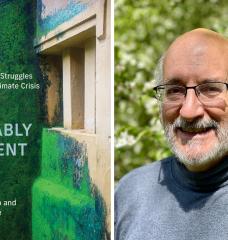
* Cover graphic for this post (as well as 3rd paragraph above) taken from New Republic, November, 2017.